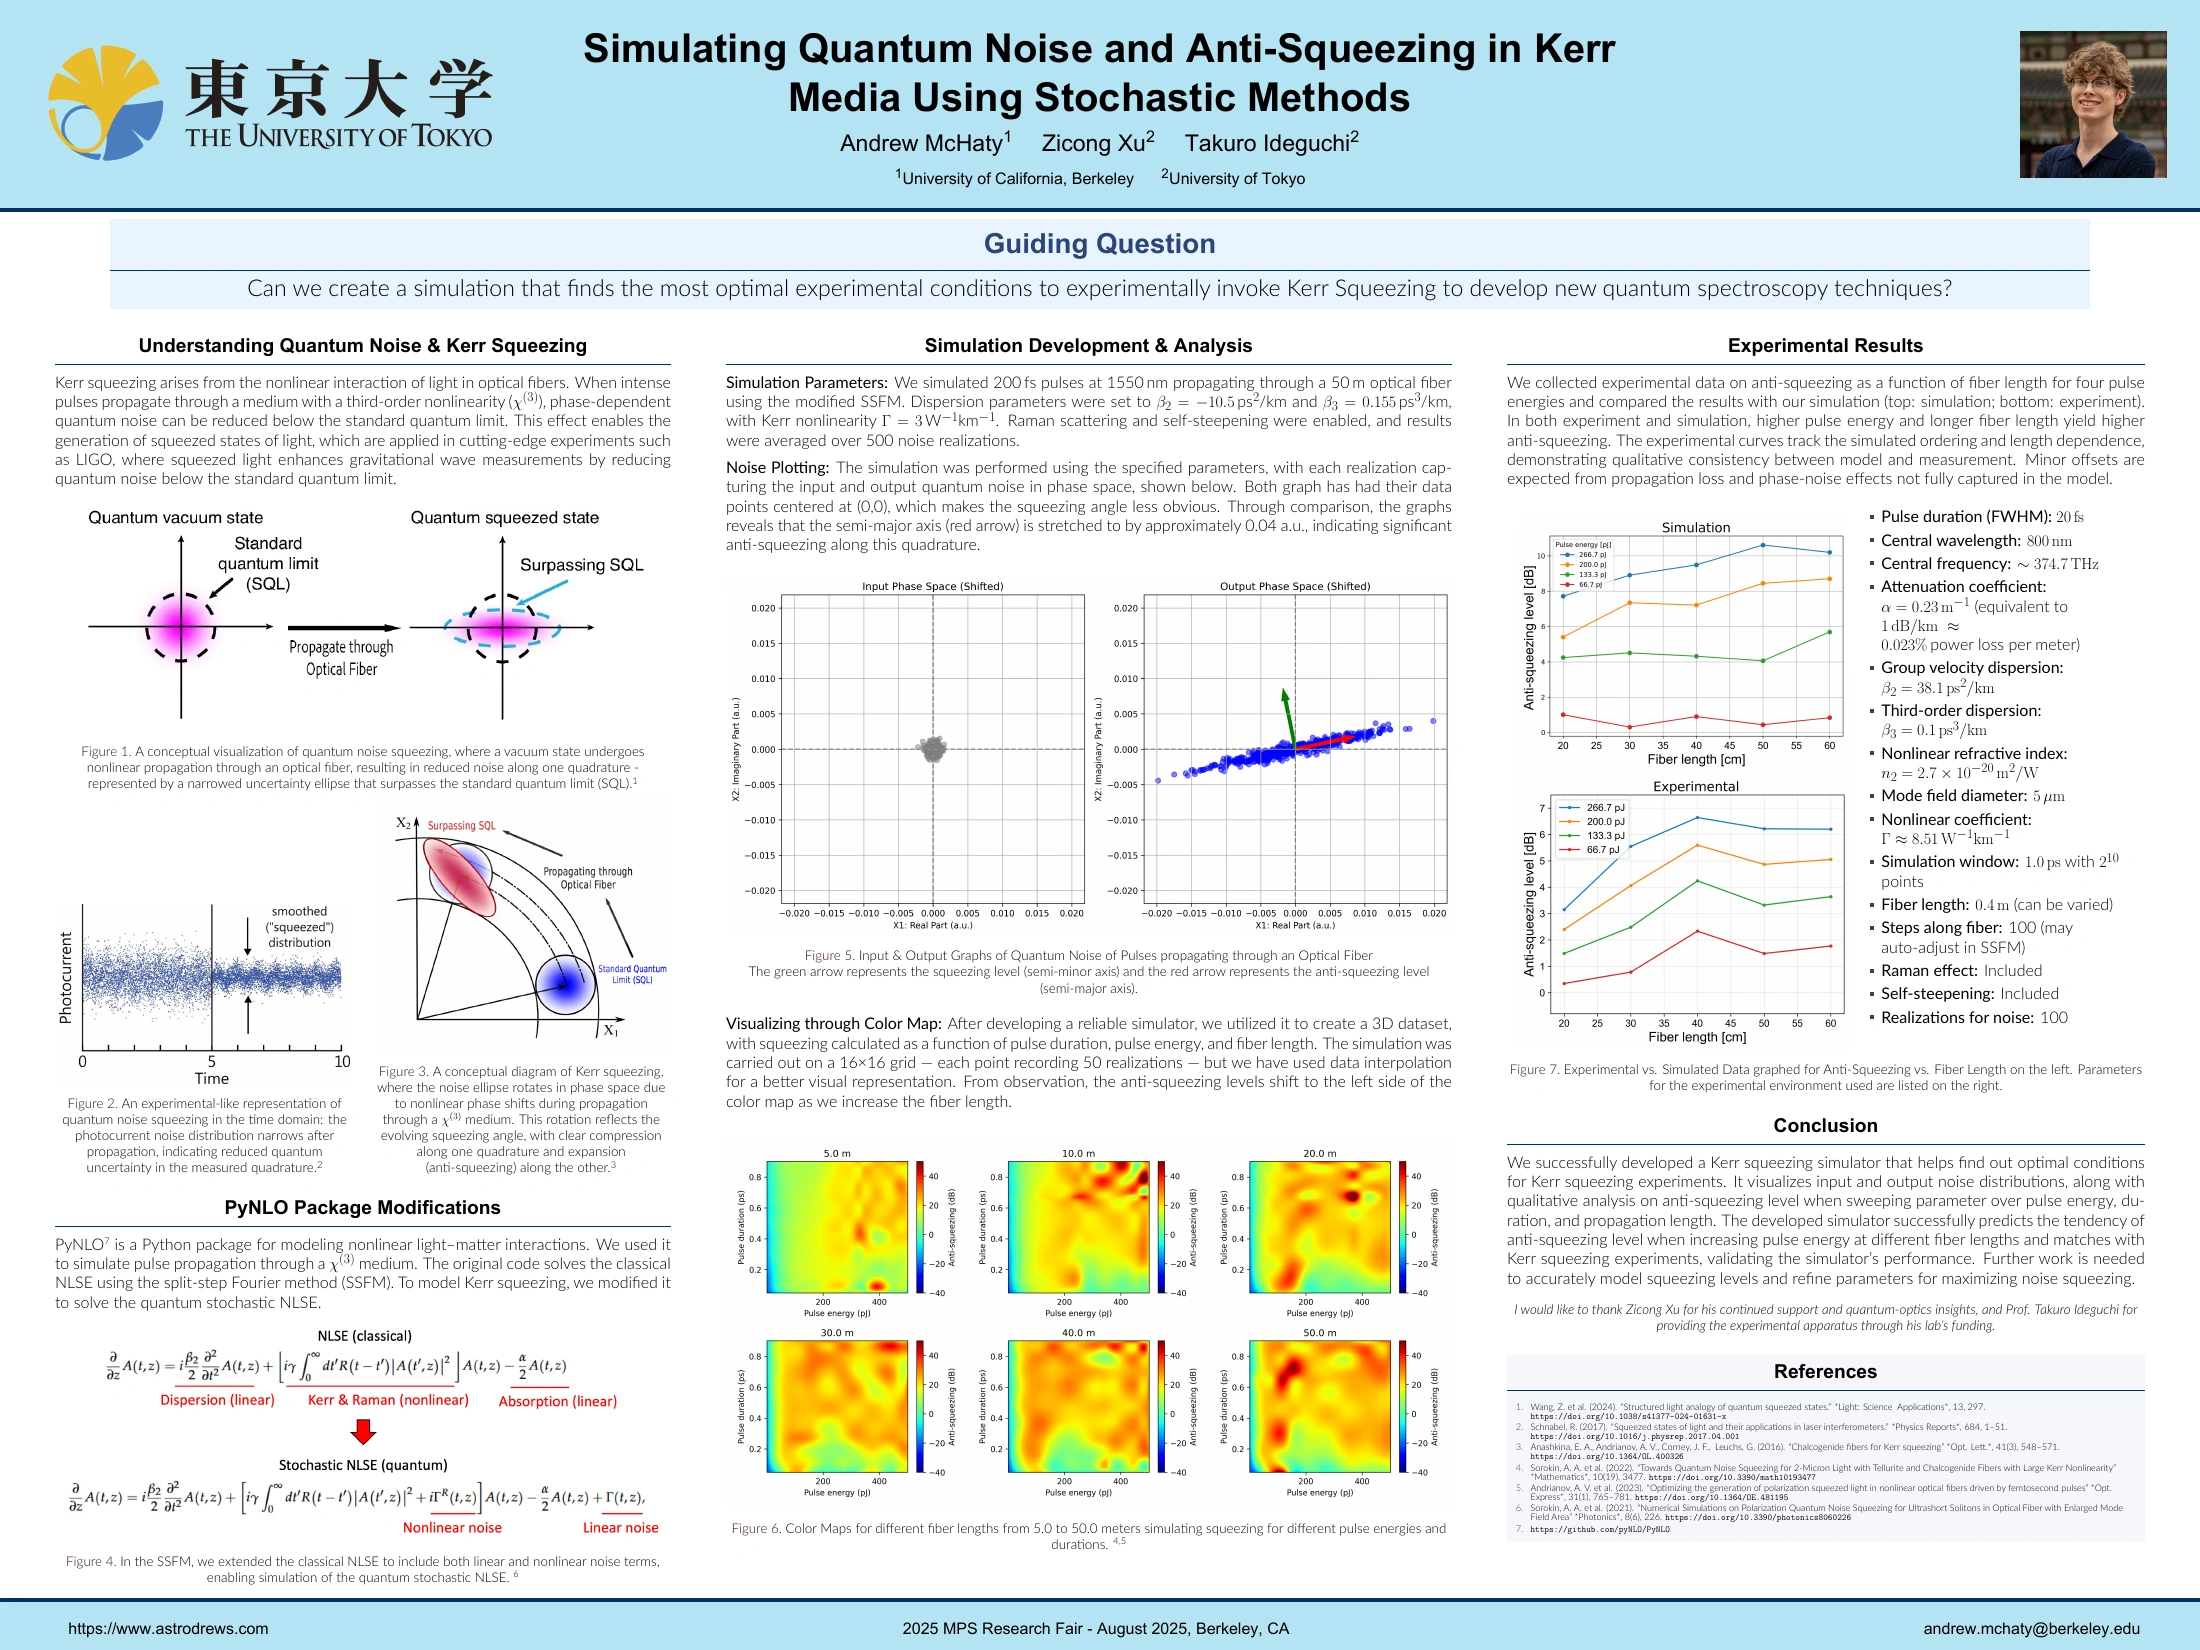
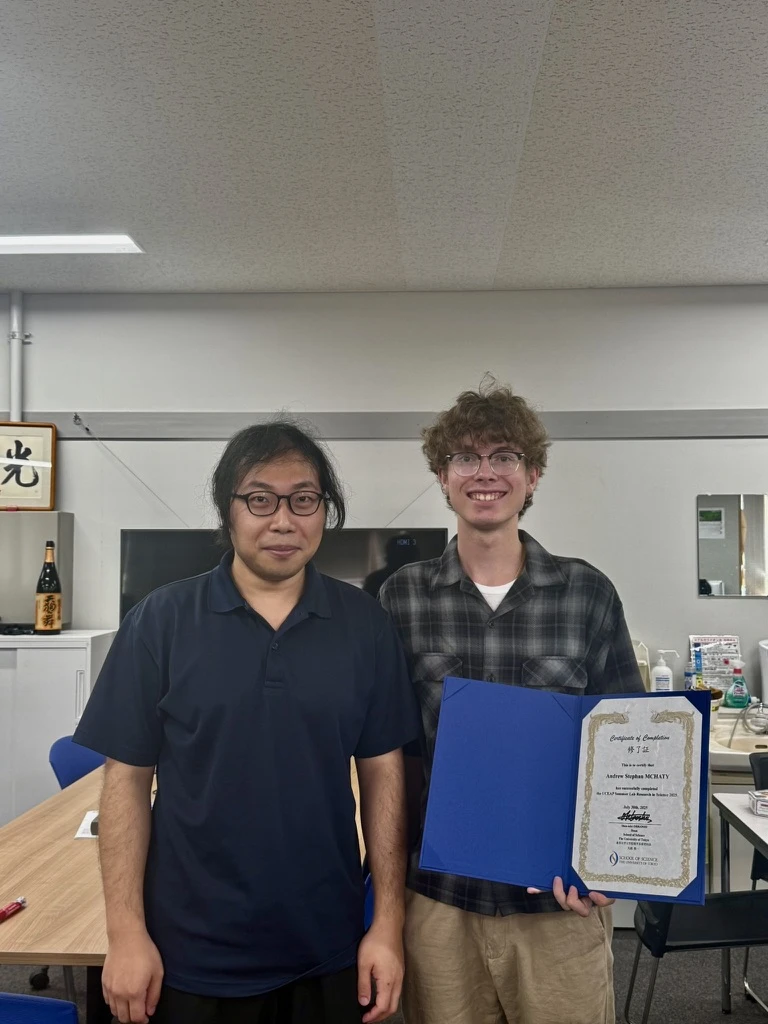
During summer 2025, I worked with Zicong Xu and Professor Takuro Ideguchi at the University of Tokyo on a quantum-optics project: simulating how the quantum noise of ultrashort light pulses evolves as they travel through nonlinear optical fibers. Our goal was to develop a computational tool that could help identify promising conditions for Kerr-squeezing experiments and future quantum spectroscopy techniques.
The project became my poster, Simulating Quantum Noise and Anti-Squeezing in Kerr Media Using Stochastic Methods, presented at the 2025 MPS Research Fair in Berkeley.
Why squeeze light?
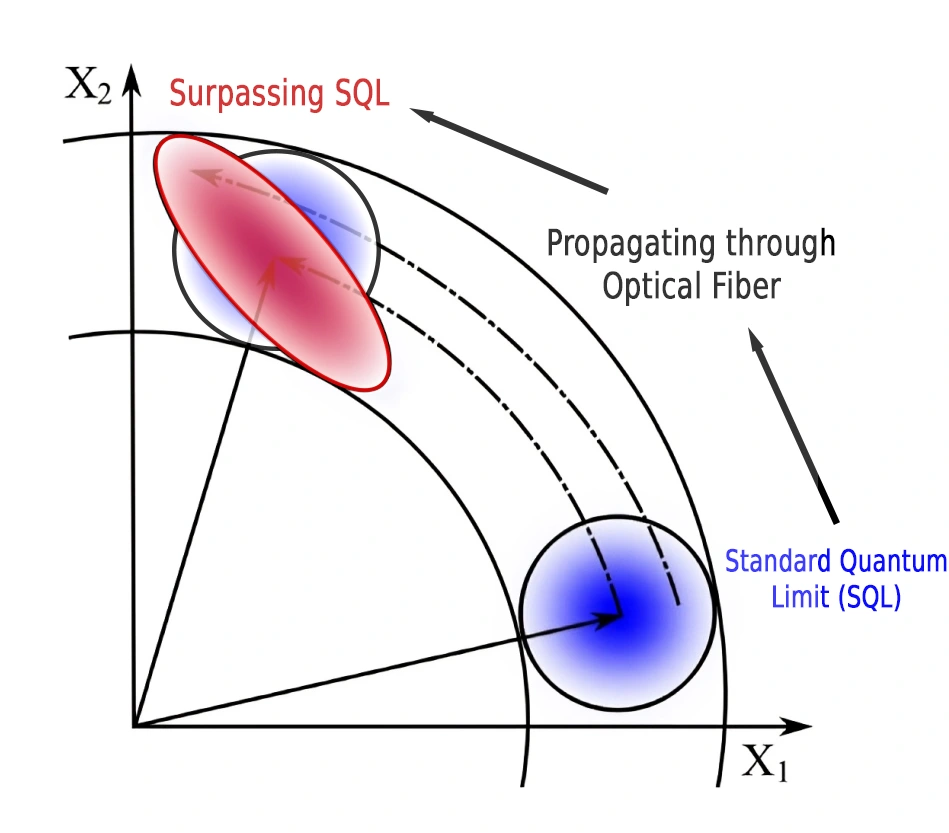
Quantum noise limits how precisely we can measure light. A squeezed state redistributes this uncertainty: fluctuations are reduced in one component of the optical field, called a quadrature, while they increase in another. That increase is known as anti-squeezing.
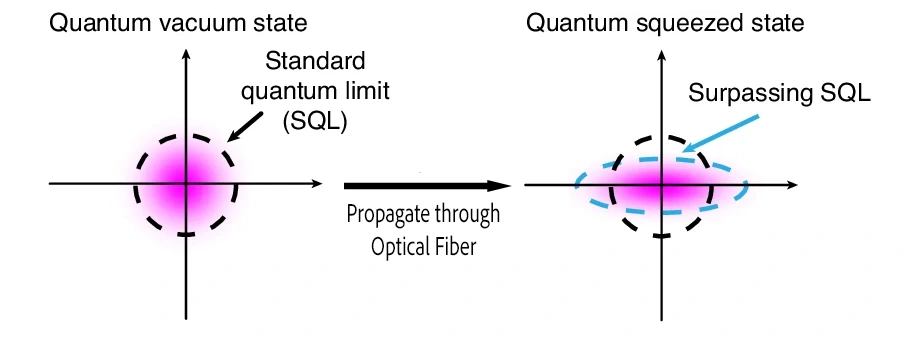
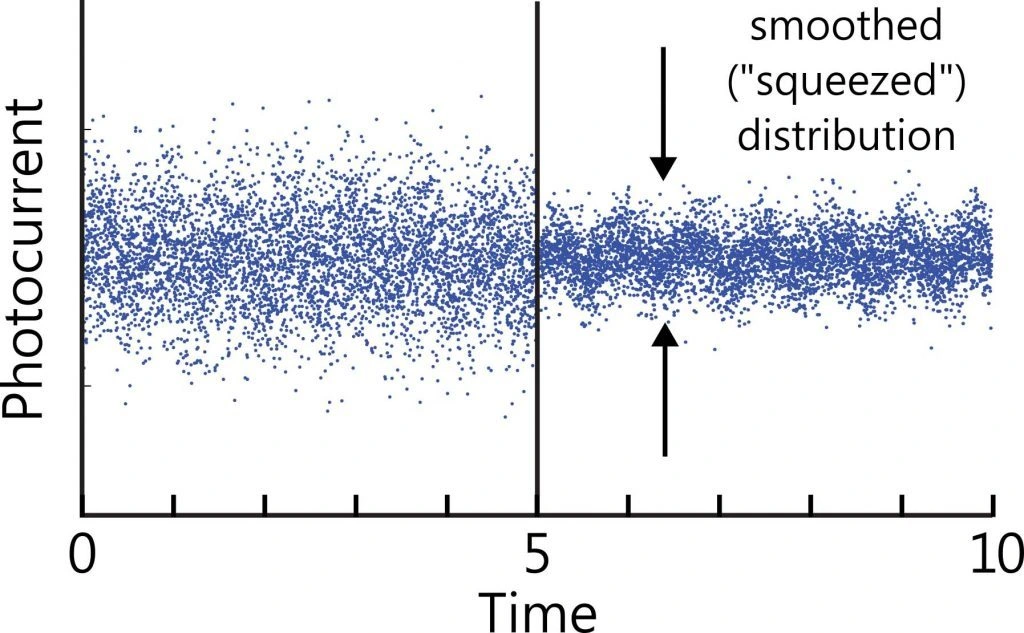
In an optical fiber, the Kerr effect makes the refractive index depend on the light’s intensity. This nonlinear interaction can change the shape and orientation of the field’s noise distribution. Understanding that evolution is important for designing experiments that aim to reduce noise in the quantity being measured.
Building the simulation
We started with PyNLO, a Python package for modeling nonlinear light–matter interactions. Its classical pulse-propagation solver uses the split-step Fourier method to solve the nonlinear Schrödinger equation. We extended that framework to include stochastic linear and nonlinear noise terms so we could investigate quantum-noise evolution.
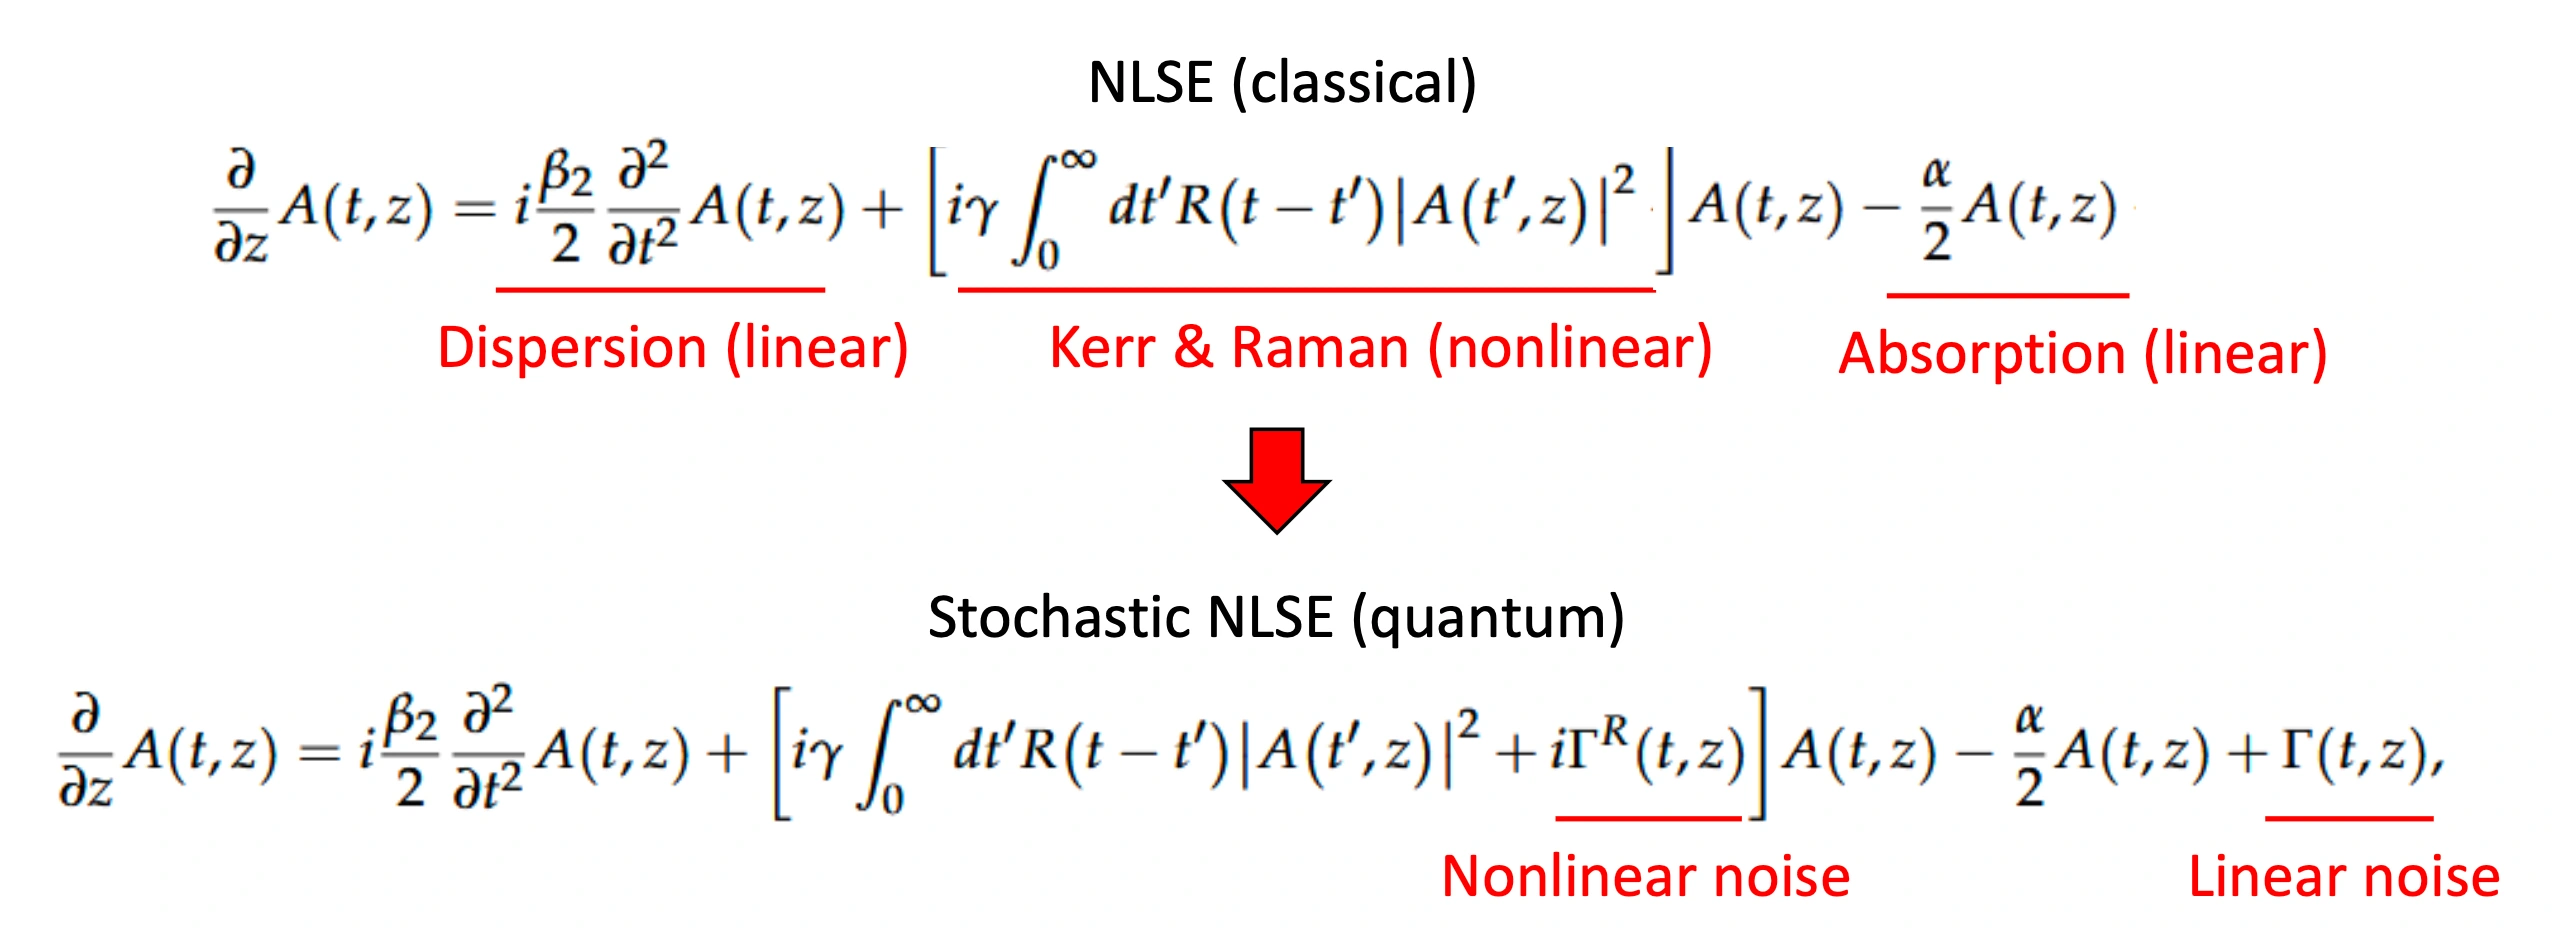
We also replaced the simplified Raman-response model with a 10-Lorentzian approximation to better represent Raman effects in the quantum-noise calculation. The simulations included Raman scattering and self-steepening.
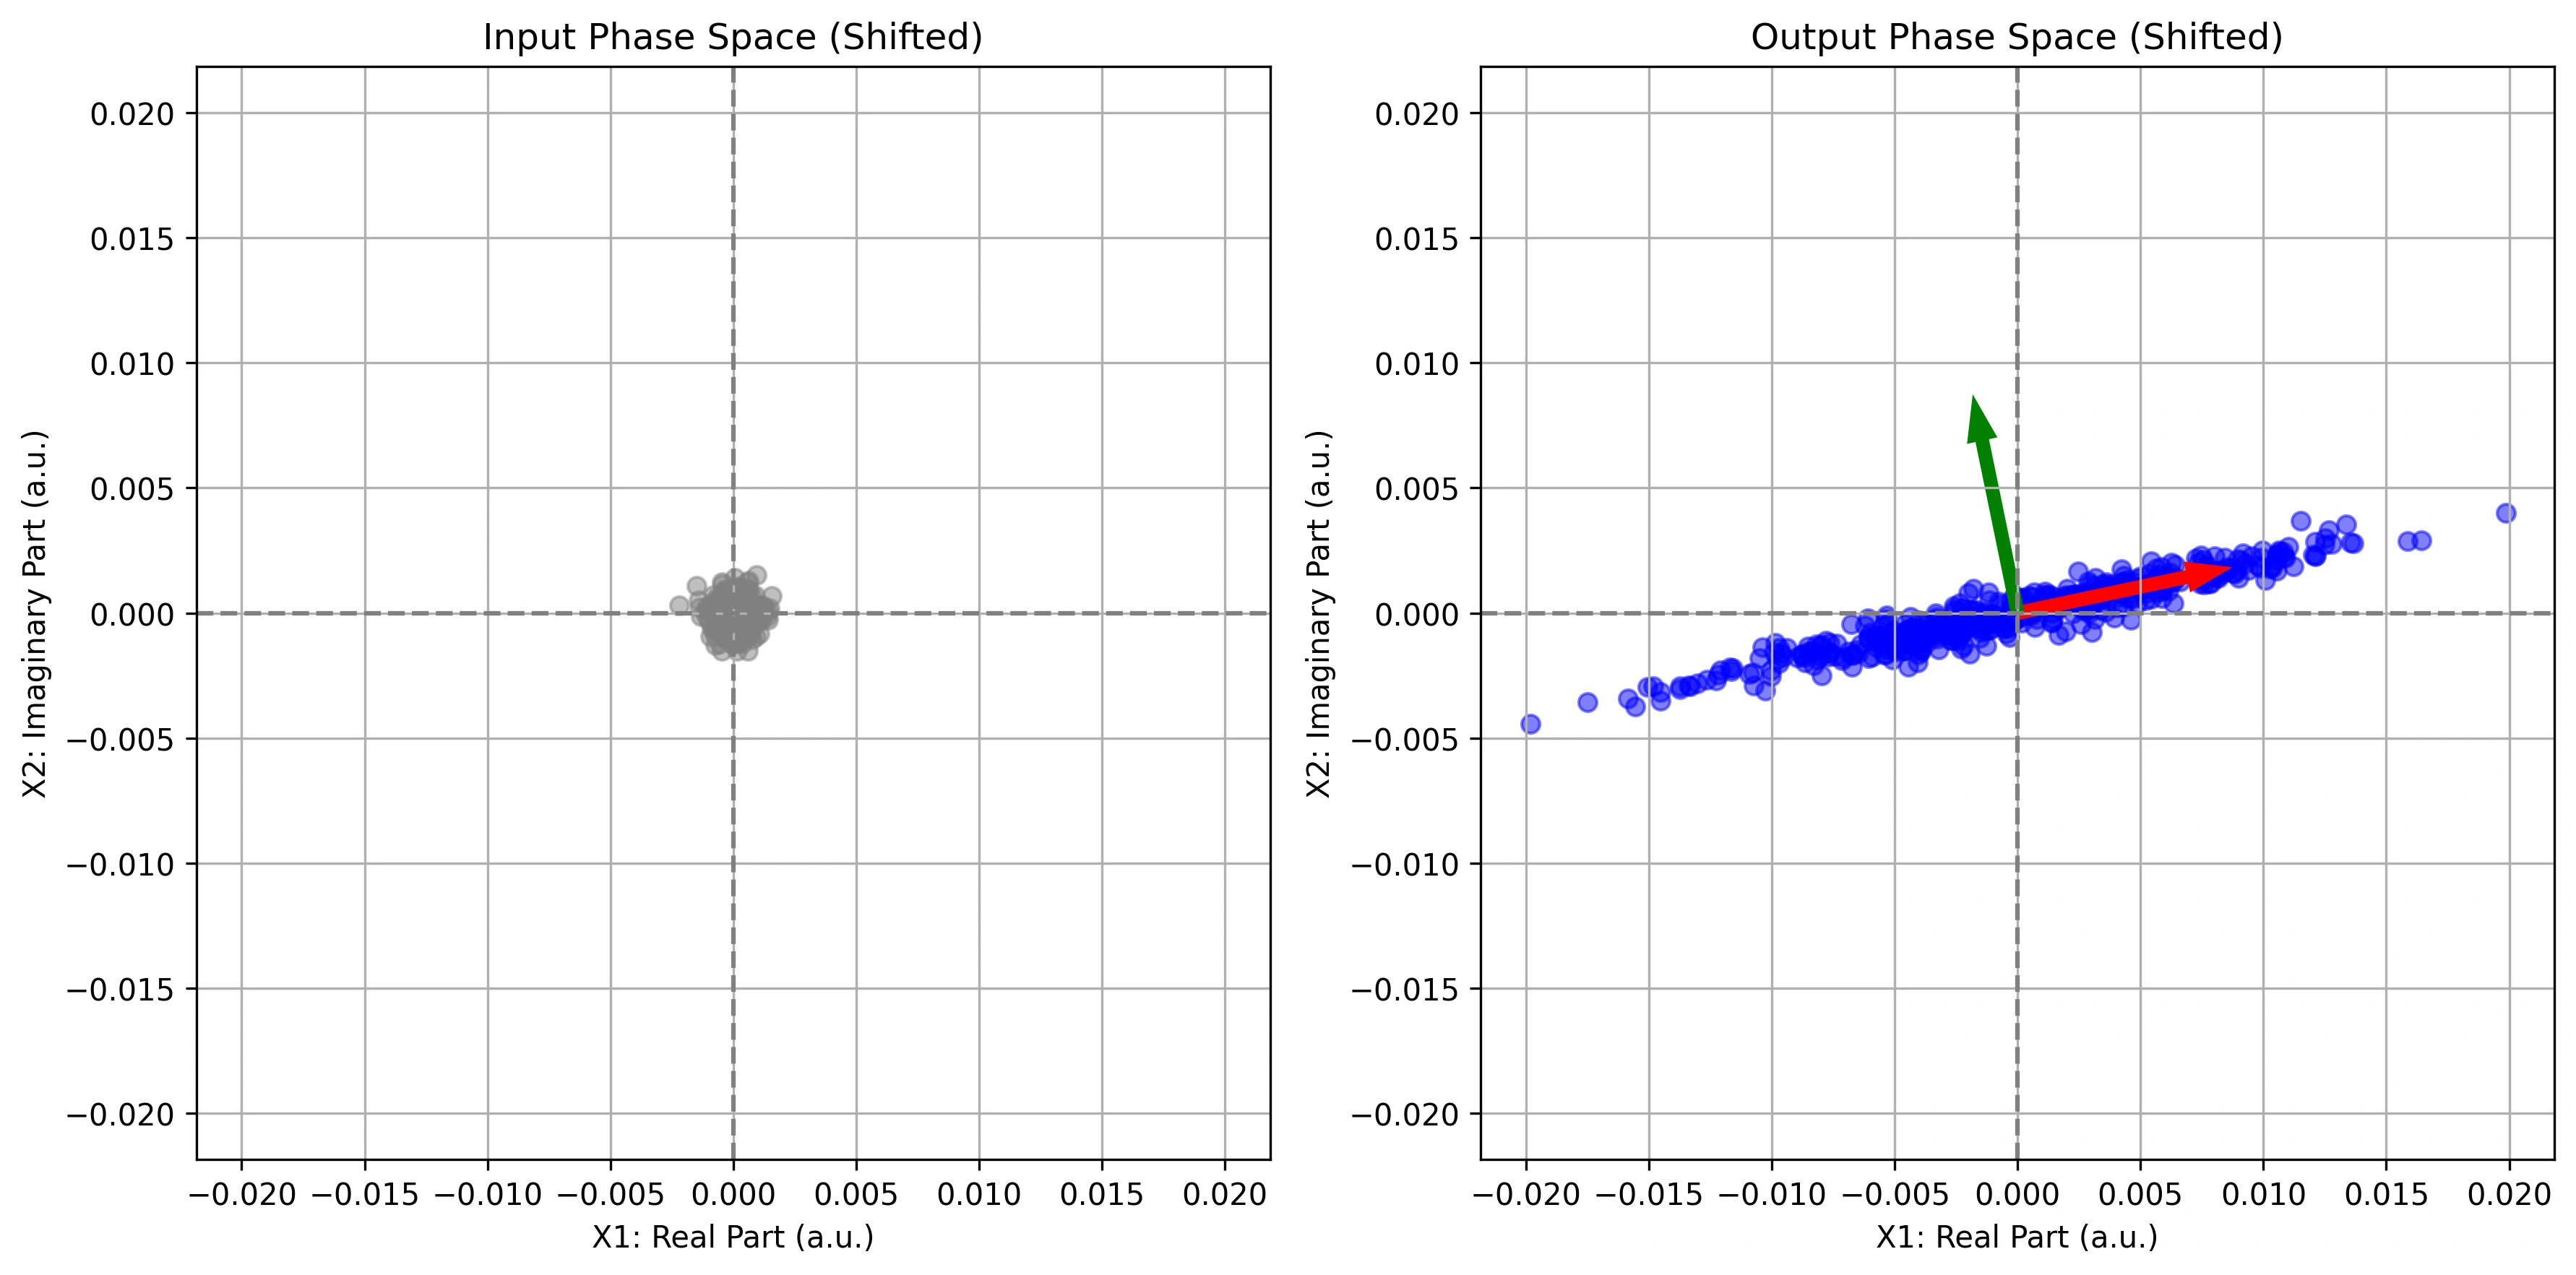
One simulation configuration followed 200-femtosecond pulses at a wavelength of 1550 nanometers through 50 meters of fiber, averaging over 500 noise realizations. By comparing input and output distributions in phase space, we could examine how propagation changed the noise ellipse and its squeezing and anti-squeezing directions.
Exploring experimental conditions
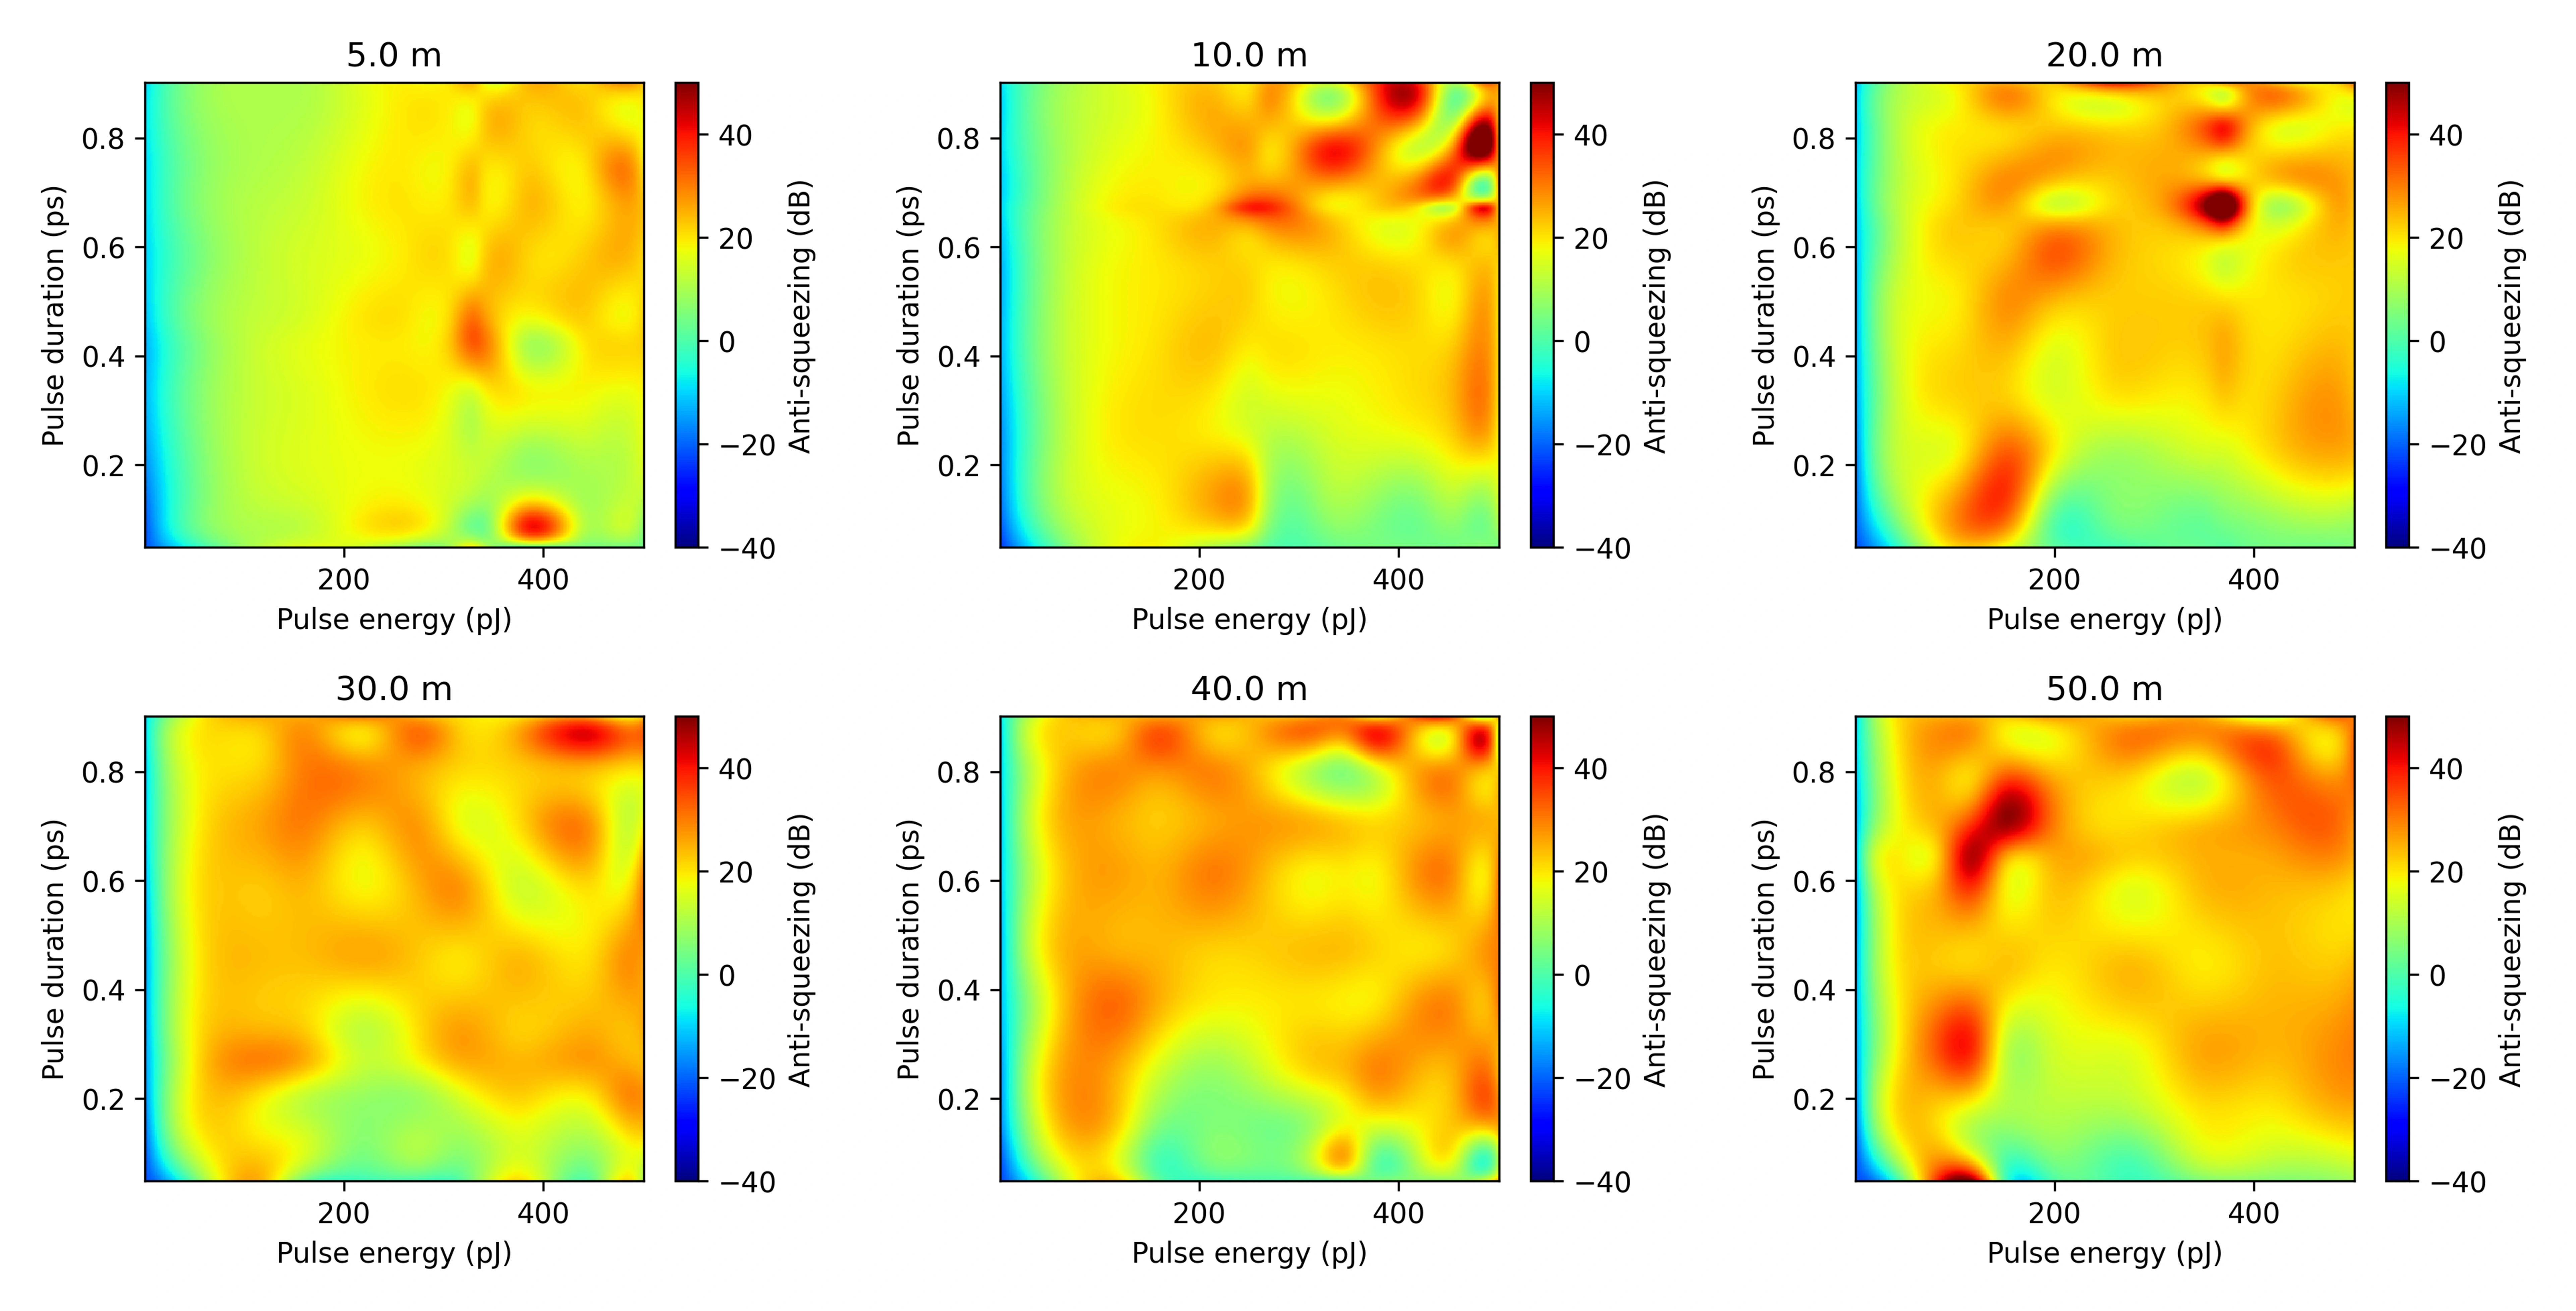
We then varied pulse duration, pulse energy, and fiber length to map the simulated noise behavior. For the parameter maps shown in the poster, each 16 × 16 grid used 50 noise realizations per point; interpolation made the trends easier to visualize. These maps helped us explore how the regions of stronger anti-squeezing shifted as the fiber length changed.
Comparing the model with measurements
For a separate experimental comparison, we examined anti-squeezing as a function of fiber length at four pulse energies. Both the simulations and the measurements showed the same broad trend: higher pulse energies and longer fibers generally produced greater anti-squeezing. The experimental curves also followed the simulated ordering by pulse energy.
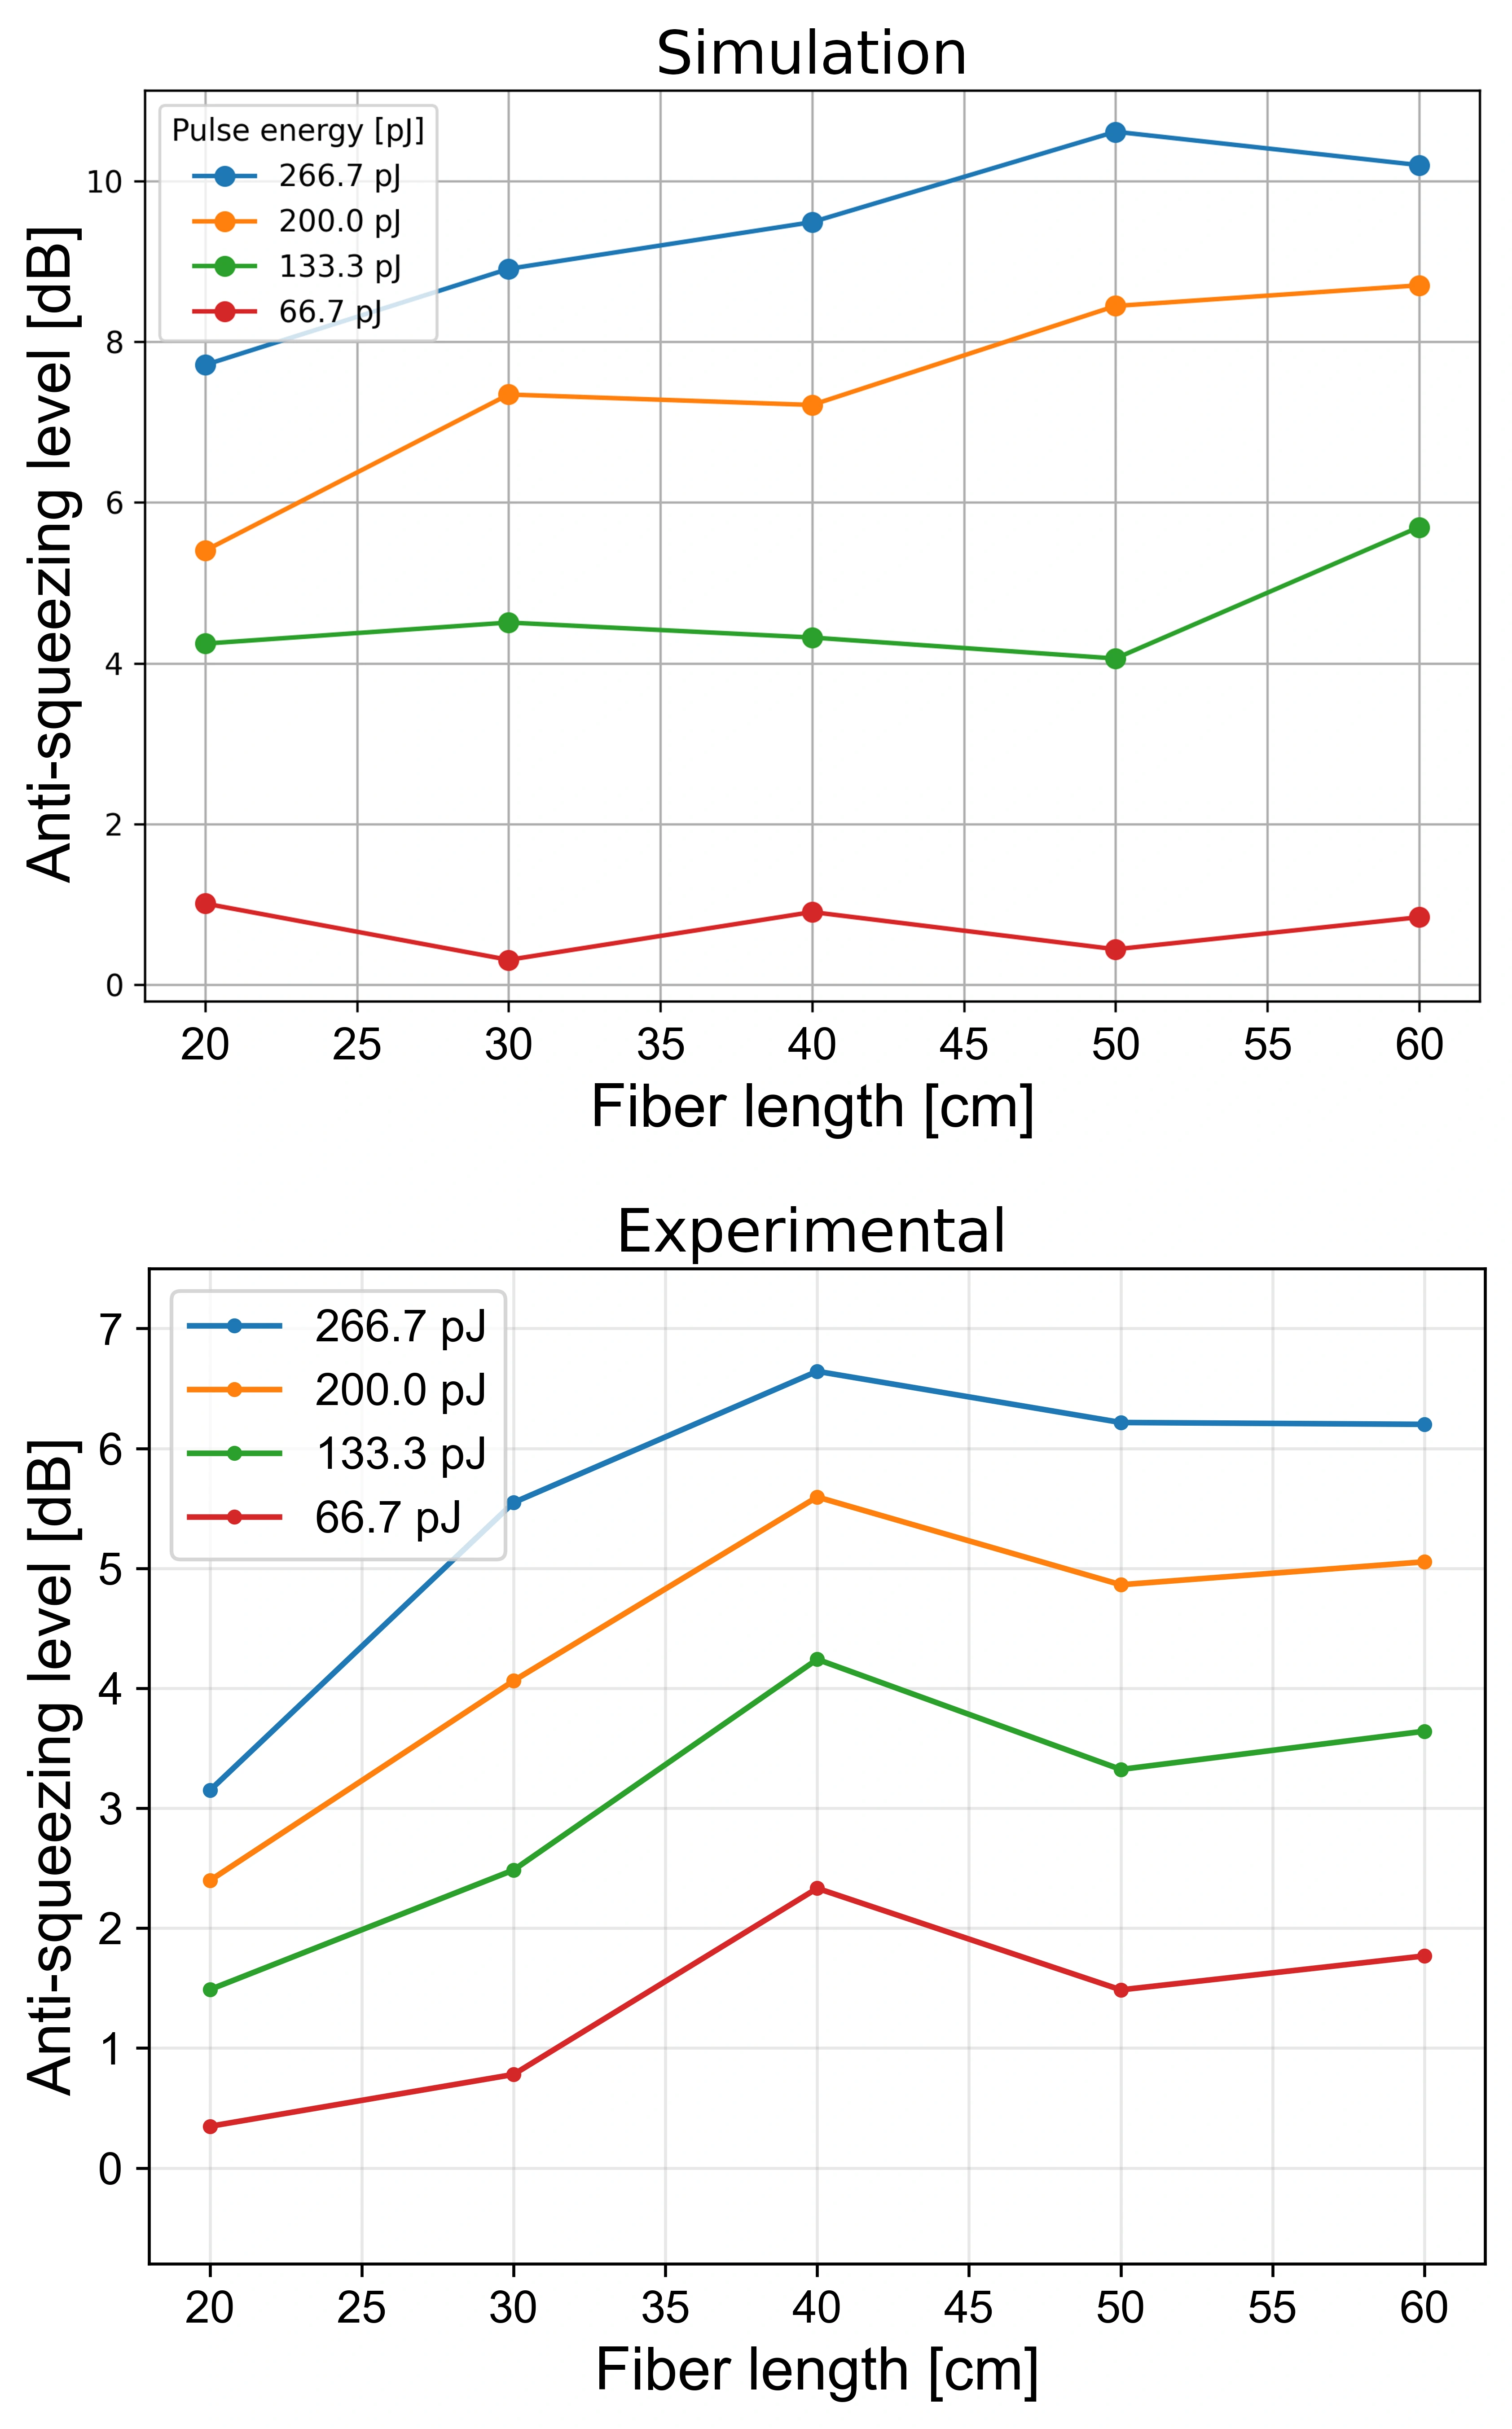
This was qualitative agreement, rather than an exact numerical match. Propagation loss and phase-noise effects that were not fully captured in the model could contribute to the remaining offsets. Further work was needed to predict squeezing levels accurately and refine the conditions for maximizing noise reduction.
What I took from the project
This work connected computational modeling with experimental quantum optics. It gave me experience extending a scientific simulation package, analyzing ensembles of noisy trajectories, and comparing model predictions with laboratory measurements. The result was a tool for exploring experimental conditions, alongside a clearer picture of the model’s strengths and limitations.
I’m grateful to Zicong Xu for his continued support and quantum-optics insights, and to Professor Takuro Ideguchi for supporting the work through his laboratory and experimental apparatus.